 on the Reports menu to expand it.
To run a BI Reporting report, do the following. On the Control Panel:
 on the Reports menu to expand it.
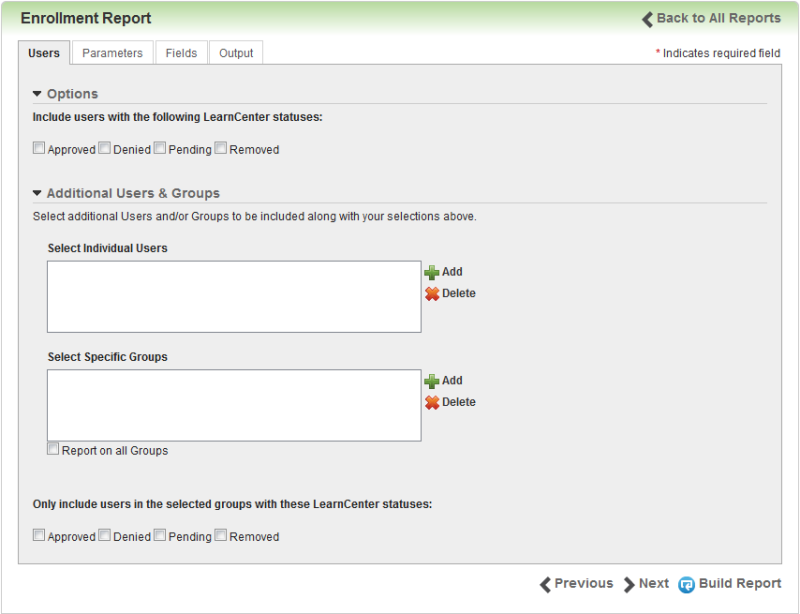
The number of tabs available depends on the type of report you selected. Reports that do not have options for Users will not have a Users tab.
|
|
BI Reporting Standard Report results only show mapped Users. Regardless of what Users you select on a report, you will only see those Users mapped to the items in the results. |
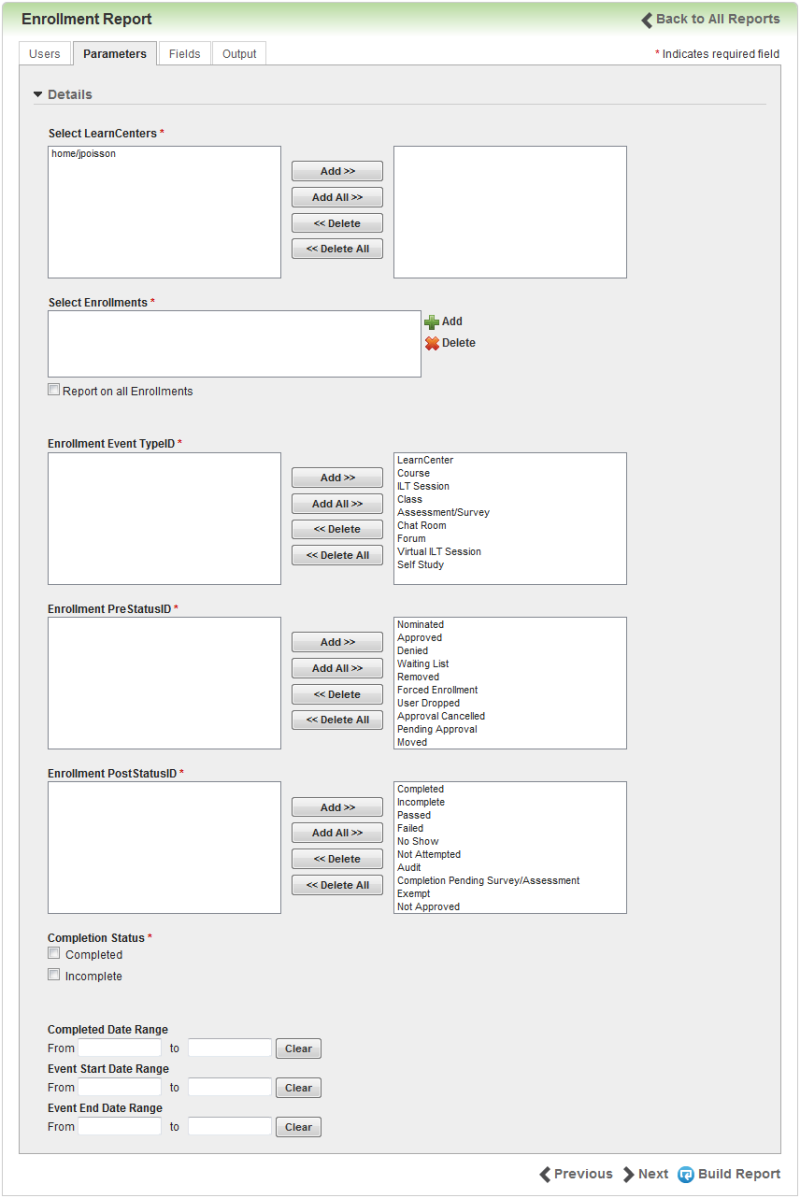
The Parameters tab contains parameters specific to each report.
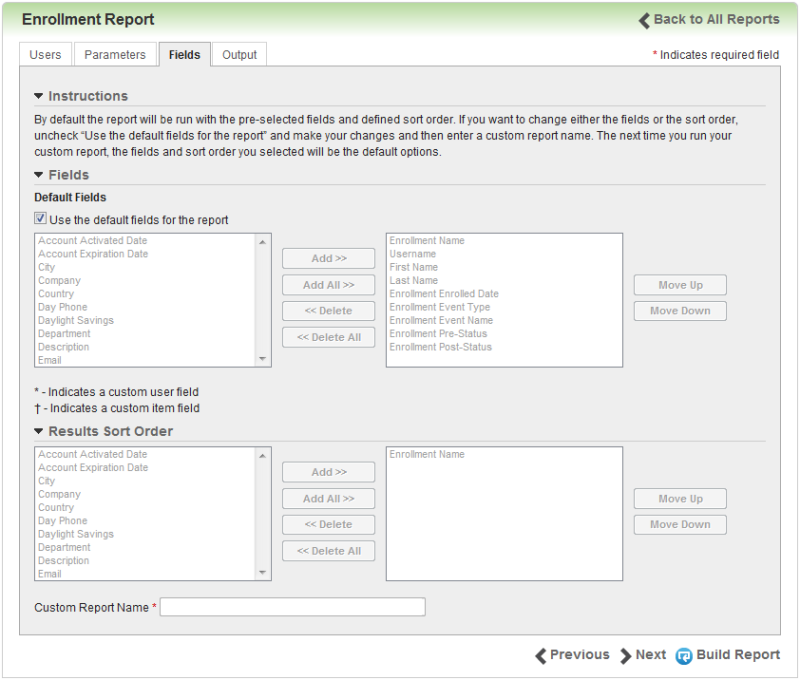
The Fields tab allows you to select from the fields that are available on the report you selected. When you first visit this page for any report, the Use the default fields for the report check box is checked by default and the Fields and Results Sort Order selections are dimmed (gray). The fields in the list boxes on the right side of the page list the pre-selected (default) fields and sort orders for the report. You can build the report as is, or you can clear the Use the default fields for the report check box to select the fields and sort order that suit your needs. Once you make changes, the report is considered a custom report.
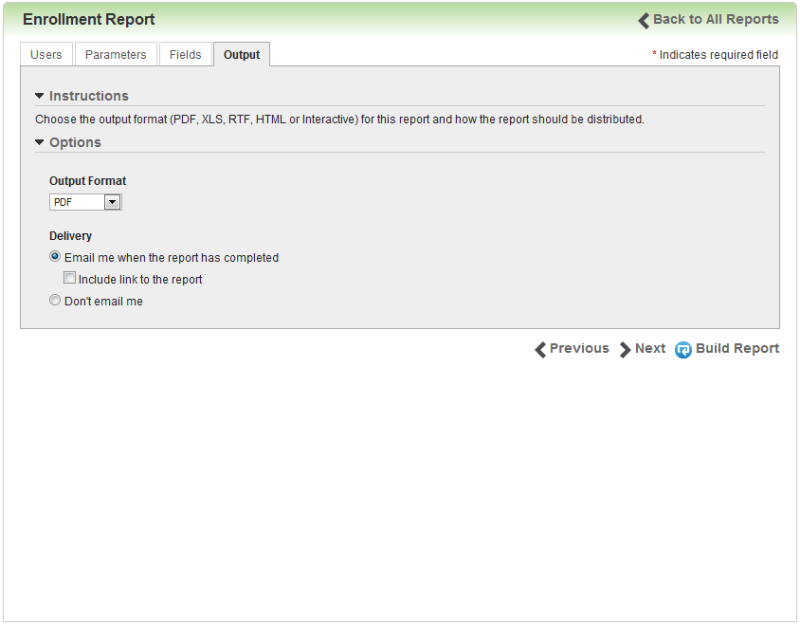
Use the Output tab to indicate in what format you would like the report to be generated.
|
|
Best Practice Tip: If you plan to use all fields in your report output, particularly with the reports that have a lot of available fields, it is recommended that you select XLS as the output, because you will be able to manipulate the size and spacing of the columns using Microsoft® Excel. You cannot manipulate or edit the outputs results for PDF, RTF, HTML files or CSV. With Interactive HTML, you can manipulate sorting and sizing in a similar manner as XLS files. The BI Reporting .CSV file format does not use any custom layout files. It will always return the columns selected for the report. |
|
|
As a Beta release, BI Reporting reports are limited to 65000 records. However, your chosen output format might have additional limitations. For example, if you include too many fields or rows of data in your output, and you reach the Microsoft® Excel spreadsheet data limit, your report data will be truncated. When generating PDF output, BI Reporting does not limit the size of the output file. However, when the size of the file approaches 2 GB, Adobe® Acrobat® Reader may no longer be able to open or handle the file. This is an Adobe limitation. When selecting the Interactive output, the complete data set that is passed to the layout should be limited to several thousand rows to achieve a responsive report. |
|
|
No report attachments will be emailed to you. You will have access to your report online for up to 90 days. This eliminates the possibility you might not receive an email with a report attachment due to file size restrictions or security rules that are put in place for your network or email system. All Users will be forced to log in to LearnCenter if you click a hyperlink to a report in an email. This ensures that only authorized Users of your LearnCenter can view reports. The LearnCenter SSO feature will work with this authentication. This security is enabled for all LearnCenters. If you opt to select the Include link to the report check box in for report emails, you have nothing more to do. The report links automatically require user authentication. If you do not want to introduce authentication or the authentication does not work with your SSO integration, you have the following options:
Disabling this authentication could open your information up to be viewed by an unauthorized party. If you are unclear as to the ramifications of disabling this feature, please contact Oracle Support for clarification. Additional information about disabling this authentication can be found on My Oracle Support (MOS) in DOC ID: 2115769.1. |
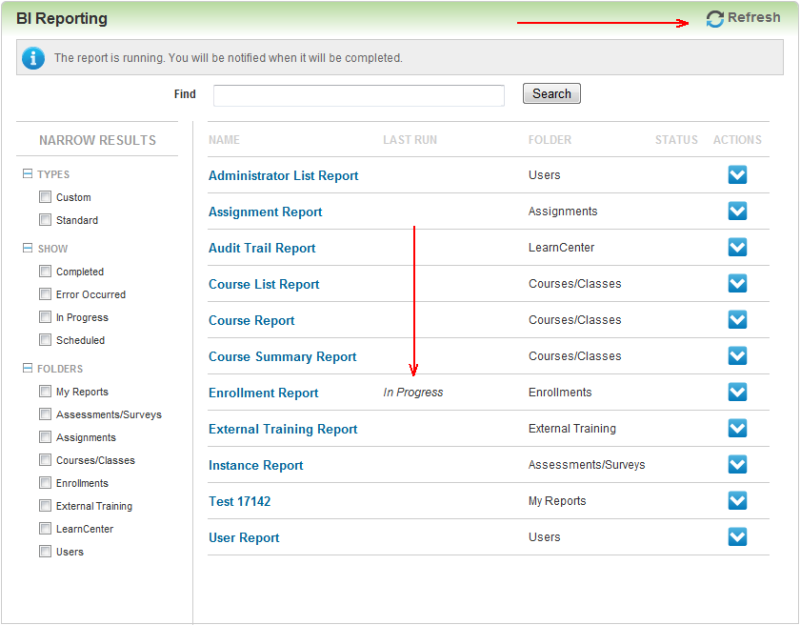
The information in the Last Run column will indicate whether your report is in progress or has completed. You can click Refresh at the top of the page to reload the page and see if your report has finished. If you selected the Email me when the report has finished check box on the Output tab, you will receive an email when it was ready.
If you want to run a report again from this page, simply click the link in the name column. Note that once you make selections in a report, those selections are saved until you change them. This means the next time you run a report, it will automatically have the same selections on the tabs as the last time you ran it. If you want, you can simply navigate to the Output tab and click Run Report without having to look at your previous selections. You can change the report selections at any time.
Interactive HTML output files are HTML files that you can manipulate.
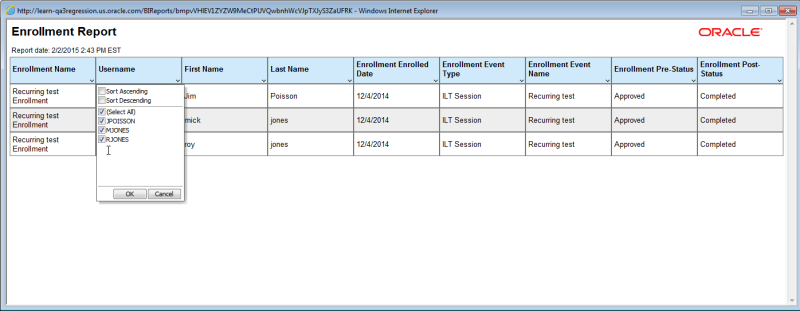
Notice in the illustration above, you can sort the columns in ascending or descending order. You can also add and remove items from the columns by selecting (adding) or clearing (removing) the check boxes.
|
|
The default Oracle company logo displayed at the top of the report output can be changed to your company’s logo or some other logo of your choice. Contact Customer Support through My Oracle Support to open a service request to make this change. (Note: If you have already had the logo changed for Transcripts, the same logo will be used for BI Reporting. Custom logos will not render if they have Adobe XMP data, they will use our default logo in place |
When you run the report, you will notice the appropriate tabs display just like they do with Standard Reports. For example, the Users tab only displays if the report has User information, and you have selected that parameter to be displayed for the report.

The Parameters and Fields tabs display the information based on the selections you made when you created the custom report.

Copyright © 2010-2015, Oracle and/or its affiliates. All rights reserved.